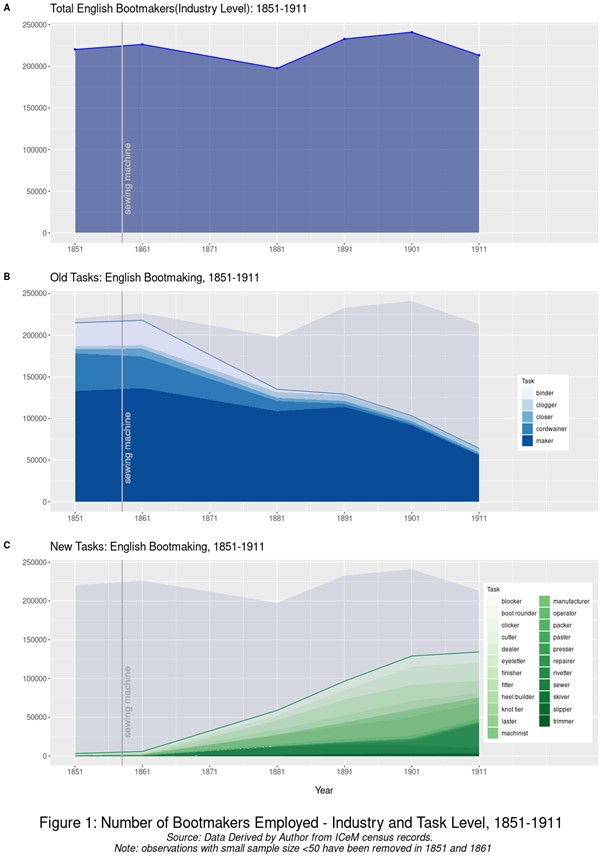
Tasks and Micro-Occupations
Welcome to the Tasks page. This will be a visualization of the changing occupational structure in Britain between 1851-1911, based on census data from the ICeM project. It is a work in progress. Please email me to discuss.
Treemap: Orders Over Time
Click a year to view the treemap of the different sectors of the British economy by census year.
Occupation: Orders Over Time (1851–1911)
Showing the growth in different sectors of the economy over the period. Sectors shown in blue are growing more rapidly than average population growth
Growth by Industry: 1851–1911
Showing growth by industry over the period. Note that the extreme outliers are primarily in industries which were very small or non-existant in 1851
Population doubled over the period: any industry growing more than 100% outpaced population growth, industries which grew less lagged.
Treemap to Tasks Level: Orders → Industries → Tasks
Management — Part I: Geographic distribution
An initial mapping of the rise of management jobs in the UK, by county.
Percentage Share of the Working Male Population
Technology by Industry
Technology
An initial mapping of the emergence of new technologies in the UK, by county. *Coming soon.
Percentage share of male population