Mapping the Second Industrial Revolution
Inequalities Institute, March 2026
Treemap: Orders Over Time
Click a year to view the treemap of the different sectors of the British economy by census year.
Occupation: Orders Over Time (1851–1911)
Showing the growth in different sectors of the economy over the period. Sectors shown in blue are growing more rapidly than average population growth.
Growth by Industry: 1851–1911
Showing growth by industry over the period. Note that the extreme outliers are primarily in industries which were very small or non-existent in 1851.
Population doubled over the period: any industry growing more than 100% outpaced population growth, industries which grew less lagged.
Treemap to Tasks Level: Orders → Industries → Tasks
Technology: Geographic Distribution
An initial mapping of the emergence of new technologies in the UK, by county.
Management: Geographic Distribution
An initial mapping of the rise of management jobs in the UK, by county.
Apprenticeship System
The apprenticeship system declines everywhere between 1851–1911. The decline is more rapid after 1881. Less urban areas seem to retain more of the system than elsewhere. What is somewhat surprising is how different the decline is by level of skill — apprenticeships decline only slightly over the period; it is Masters and Journeymen who disappear.
Total Participation
Role Breakdown
Occupational Skills Inheritance
| Occupation | 1851 | 1861 | 1881 | Difference | OccScore | SonsScore |
|---|---|---|---|---|---|---|
| Coal Miners | ||||||
| Farmer, Grazier | ||||||
| Bricklayer | ||||||
| Mason | ||||||
| Carpenter, Joiner | ||||||
| Agricultural Labour | ||||||
| Blacksmiths | ||||||
| Butchers | ||||||
| Tailors | ||||||
| General Labour | ||||||
| Gardener | ||||||
| Innkeepers |
Beneficiaries of Transition: Intergenerational Mobility and Technological Change in Victorian England
Two Channels:
Technological change in Victorian England impacted on social mobility through two channels.
The Incumbent Channel
Two case studies: tailors and bootmakers. Whether a father's trade is on the winning or losing side of a technological transition shapes what the next generation can access. Jewish immigrant tailors adopted the sewing machine more rapidly than their English counterparts, and their sons inherited that advantage. For bootmakers, geography determined which side of the transition a family was on. New factory jobs concentrated in Northamptonshire and Leicestershire, and sons born there had very different outcomes from sons in the 38 counties where the trade contracted.
The New Jobs Channel
Mechanization creates occupations that did not previously exist: sewing machinists, electrical engineers, motorcar drivers. Who fills them, and where do they emerge? The geography of new job creation in bicycle manufacturing illustrates how unevenly these opportunities were distributed across England.
The Parent Channel (impact on incumbents)
Two different industries. tailoring and domestic bootmaking, seem to tell a similar story. Where the father's trade is thriving, sons are protected from downward mobility and channelled into higher-status occupations when they leave. Where it is contracting, sons scatter across the full hierarchy, and a substantial share fall far below their fathers.
Tailors: Pale of Settlement Sons vs. English Sons
Sons of Pale-born tailors (1891 census) linked forward to 1911. Every father is a tailor — the comparison is purely about what happens to the next generation, conditional on the same starting point. Tailors sit at the 68th percentile of the 1911 workforce.
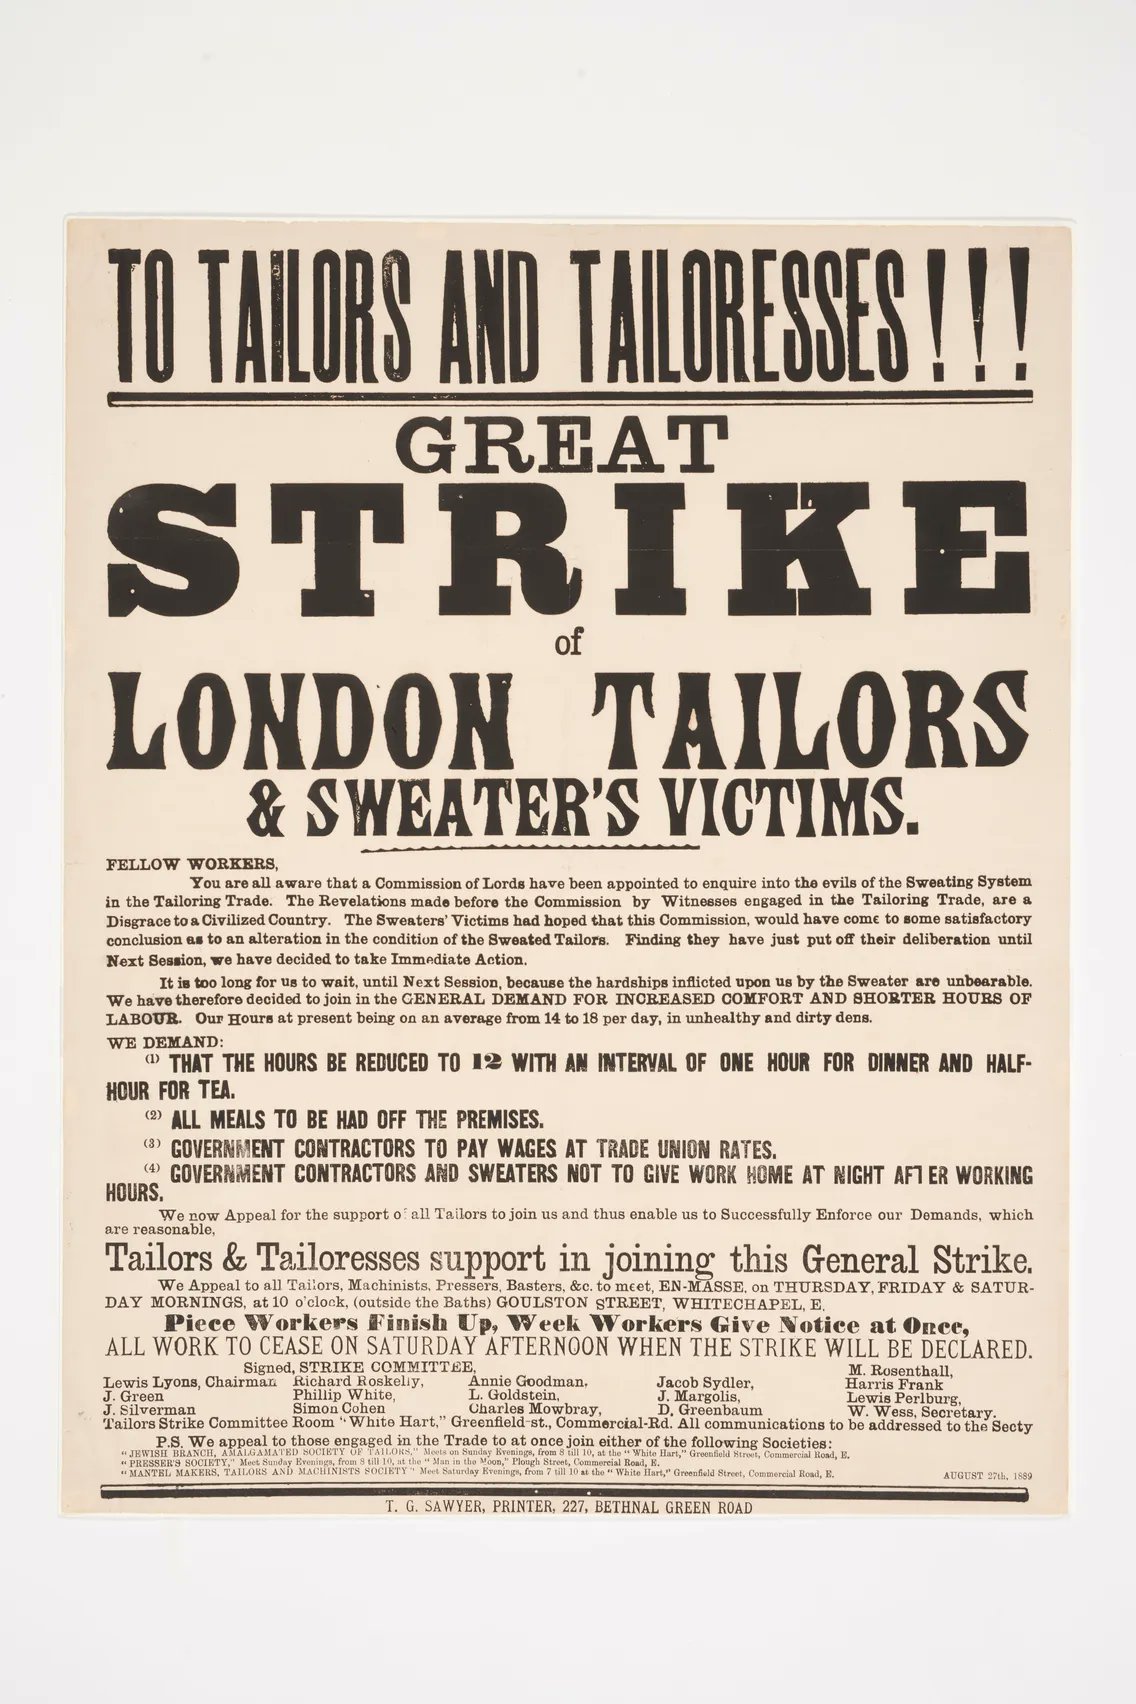
- Pogroms and the May Laws triggered a large wave of Jewish emigration from the Russian Empire — more than 2 million Jewish people fled between 1881 and 1920.
- Jewish immigrants from the Pale of Settlement entered the tailoring trade from the 1880s onwards, concentrated in London's East End, Leeds, and Manchester.
- They brought organisational practices that accelerated sewing machine adoption in ready-to-wear production.
- Jewish tailors adopted the sewing machine more rapidly than their English counterparts.
- The ethnic economy provided both a floor (preventing falls into unskilled labour) and a ladder (channelling leavers into commercial and retail occupations).
Mean rank change (percentile points)
Direction of movement
Bootmakers: Decline Region Sons vs. Flourishing Region Sons
Sons of bootmaker-headed households linked forward 30 years (1851→1881 and 1861→1891).
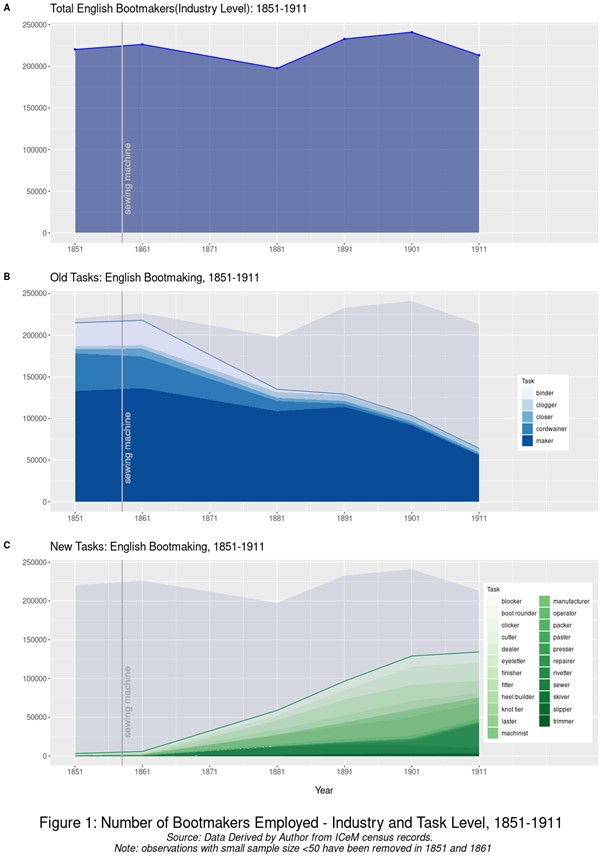
- The English bootmaking industry mechanised with the sewing machine in 1858, shifting from artisanal craft production to factory-based manufacturing.
- The new factory jobs were geographically concentrated: nearly half of all new bootmaking employment emerged in just two counties, Northamptonshire and Leicestershire.
- Artisanal jobs declined in 38 of 42 counties. Sons inheriting the trade in these places entered a contracting industry.
- Sons in Growth counties are protected from downward mobility and half as likely to become general labourers as sons in Decline counties.
- Every father in both samples is a bootmaker. Same occupation, but different geography.
The Geography of Creative Destruction
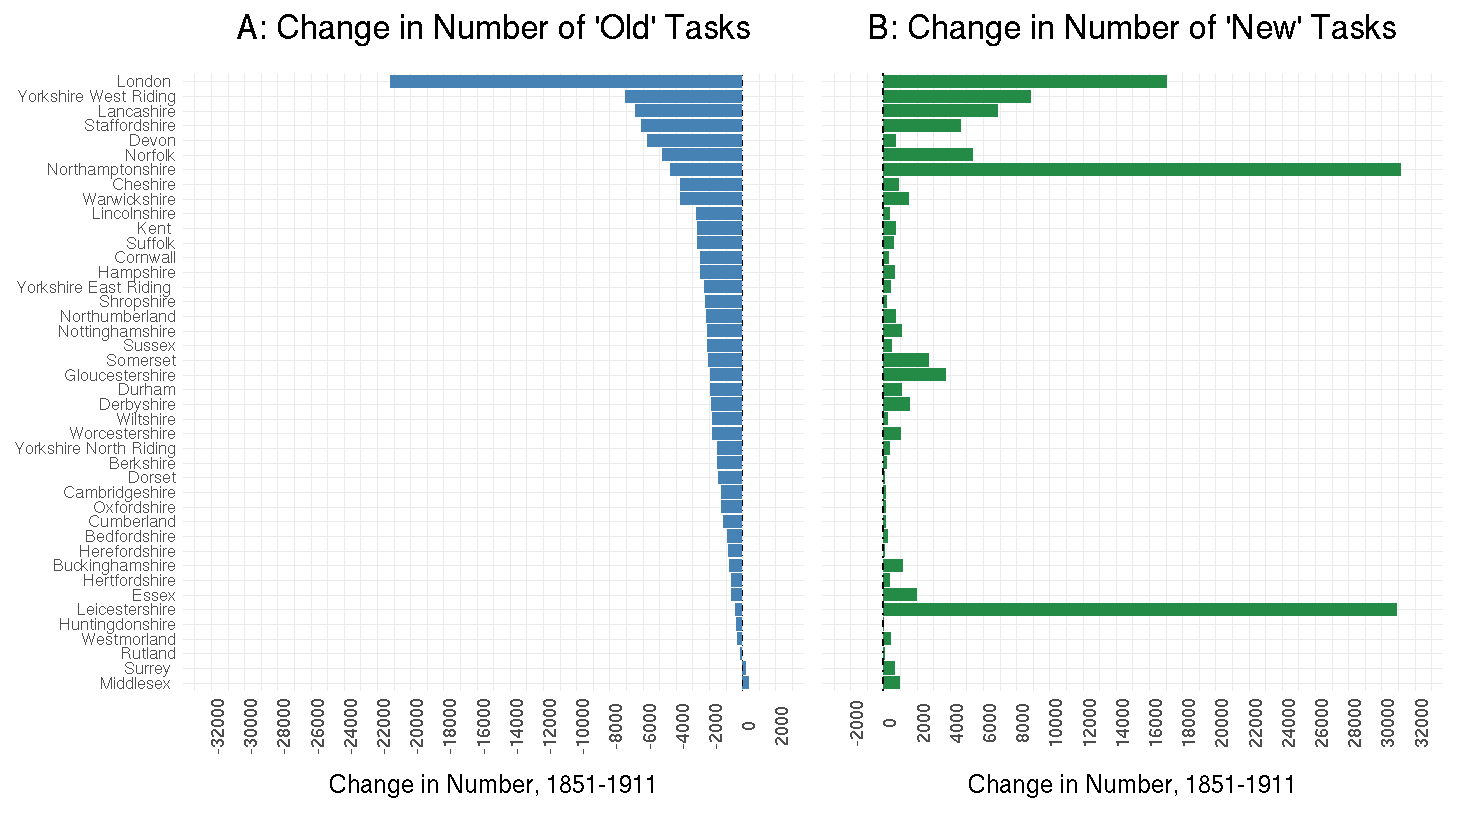
- Old jobs disappeared everywhere.
- New jobs emerged almost exclusively in Northamptonshire and Leicestershire.
- 38 of 42 counties saw net job loss.
- The industry relocated to the East Midlands.
- Same trade, different futures depending on where you were born.
Bootmakers: Growth vs. Decline Counties
Sons of bootmaker-headed households linked forward 30 years (1851→1881 and 1861→1891). Counties classified by employment change in bootmaking: Growth (Northamptonshire, Leicestershire), Steady, and Decline (38 of 42 counties). Bootmakers sit at the 54th percentile of the workforce.
Occupational Inheritance Rate
Share Becoming General Labourers
The Local Labour Market Channel
Who fills the new jobs when an industry grows? The maps below show where new jobs emerged in three sectors — electrical trades, bicycles, and bootmaking — and who the fathers of those workers were. If geography is doing the work rather than family transmission, we expect to see the new workers drawn from a wide range of father occupations, not concentrated in the same trade as their fathers.
Electrical Trades: Where New Jobs Emerged
Bicycles: Where New Jobs Emerged
Discussion
Victorian mobility
Long (2013), Zhu (2024), Clark, Cummins & Curtis (2024) — how much mobility was there in Victorian Britain, and how do we measure it?
Immigrant advantage
Abramitzky et al. (2021), Boustan (2017), Pérez (2019) — immigrant children do better, but why?
Intergenerational gaps
Chetty et al. (2020), Collins & Wanamaker (2022) — same starting point, different group, different outcomes.
Geography of opportunity
Chetty et al. (2014) — where you grow up matters.
Creative destruction
Kastis & Vipond, Organisational Practices and Technology Adoption; Vipond, Young Workers and Technological Unemployment.
New work
Autor, Chin, Salomons & Seegmiller (2024) — the origins and content of new work, 1940–2018. Connor, Kemeny & Storper (2024) — frontier workers as seedbeds of inequality and prosperity.
Technology, tasks, and inequality
Ebert, Heldring, Robinson & Vollmer (2024) — the Industrial Revolution breaks down the old order. Gray, O'Keefe, Quincy & Ward (2025) — task-based inequality between groups over the long run.
Conclusion
1. The necessity of micro-occupations
Sub-industry level occupation data is necessary to track the emergence of new jobs. I construct approximately 8,000 micro-occupations across 773 industries.
2. Four types of new jobs
— New jobs in brand new industries: approximately 500,000 workers in occupations that did not exist before.
— New jobs common across many industries: contractors, agents, supervisors, foremen, operators, managers, factory workers, manufacturing workers.
— New jobs that are industry-specific: ashphalter, sewing machinist, welter, motorcar driver, railway signalman, electric engineer, telephone operator.
— New jobs by expansion of existing professions: teaching, dentistry, medicine.
3. Stickiness of skills inheritance
Despite the new opportunities created by technological transition, I observe substantial stickiness in occupational skills inheritance across many industries.
4. Beneficiaries of transition
The beneficiaries of technological transition are not random. Pale tailors' sons and growth county bootmakers' sons hold their positions or improve, while everyone else falls.